


 ChatGPT
 Claude
 Perplexity
 Gemini
 Grok
Grok
Fixed Price vs Time and Material Contracts: Which Protects You More?
Confused about fixed price vs time and material contracts? Compare the pros, cons, risks, and ideal use cases to choose the right software development contract for your project.


 By Ebrahim Khan
12 min read
Build versus buy is no longer a question about software; it is a question about where a company intends to compete. Off-the-shelf platforms promise speed and usually deliver it, with many configured and live within weeks.
Yet SaaS management vendors such as Zylo and Productiv have repeatedly reported that organizations leave roughly half of their provisioned licenses unused, while per-seat pricing compounds as headcount grows.
Custom software reverses that cost curve but introduces delivery risk: research by McKinsey and the University of Oxford found that large IT projects ran 45% over budget on average while delivering 56% less value than predicted.
In the illustrative 250-user model analyzed below, a custom platform costs 53% more than its SaaS alternative in year one, breaks even around month 29, and finishes five years roughly $820,000 cheaper. Whether that trade is worth making depends less on arithmetic than on differentiation.
This guide gives Product VPs a feature trade-off matrix, five-year TCO projections, a breakeven analysis with sensitivity scenarios, and a decision matrix grounded in core business differentiation.
Off-the-shelf software is engineered for the median requirements of a vendor's customer base, sharing development costs and compliance certifications across thousands of customers but conforming your process to its configuration options means competing with the same operational playbook as every rival that bought the same product.
Custom software inverts that relationship. The organization defines the workflow, owns the data model, and sets the roadmap, but it also funds development, maintenance, security, and the delivery risk that accompanies any engineering program.
The question for a Product VP is therefore not which option is cheaper in isolation, but which option allocates capital to the capabilities customers actually pay a premium for.
Wardley mapping offers a useful lens. Capabilities evolve from genesis through custom-built and product stages toward commodity. Payroll, email, and general ledger accounting sit firmly at the commodity end and should almost always be bought.
Pricing algorithms, underwriting models, logistics optimization, and proprietary customer experiences often remain in the custom-built stage, where differentiation still exists. As AI capabilities depend increasingly on proprietary data and workflow context, the capabilities worth owning are becoming more strategic, not less.
Across time to value, cost behavior, workflow fit, differentiation, integration flexibility, data ownership, and lock-in risk, off-the-shelf and custom software sit at opposite ends of a trade-off spectrum, with a hybrid buy-core-build-edge approach capturing much of the benefit of each.
| Dimension | Off-the-Shelf (SaaS/COTS) | Custom Software | Hybrid (Buy Core, Build Edge) |
| Time to initial value | Weeks to 3 months | 4–12 months for a production MVP | 2–6 months |
| Upfront investment | Low: implementation and configuration | High: discovery, design, and build | Moderate |
| Recurring cost profile | Per-seat or usage fees that scale with growth | Maintenance, hosting, and enhancement | Subscriptions plus a smaller maintenance base |
| Workflow fit | Partial; gaps handled by workarounds | Designed around priority workflows | High for differentiating workflows |
| Competitive differentiation | Low; equally available to competitors | High | High where it matters |
| Integration flexibility | Limited by vendor APIs and rate limits | Designed around your ecosystem | High through an owned API layer |
| Data ownership & portability | Vendor-controlled schema and export limits | Full ownership | Full for owned layers |
| Roadmap control | Vendor-driven | Fully internal | Shared |
| Security and compliance | Inherited certifications, shared responsibility | Full control and full evidence burden | Split by component |
| Vendor lock-in risk | High | Low when code and IP are owned | Moderate and contained |
| Cost behavior as users grow | Rises with every seat | Largely flat relative to users | Partially flat |
| Maintenance burden | Vendor-managed | Commonly 15–25% of build cost per year | Split by component |
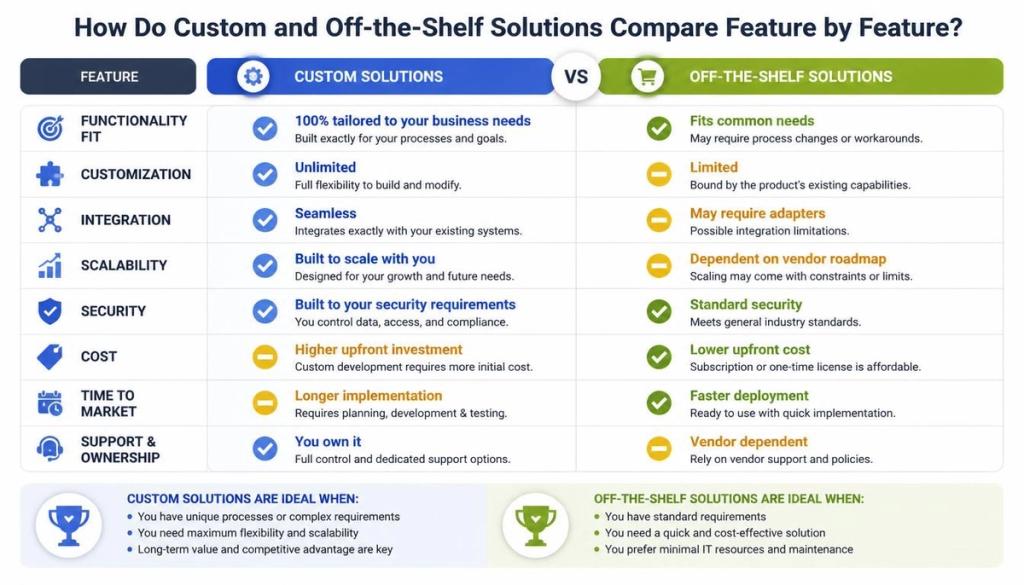
Two trade-offs deserve particular attention because they rarely appear in vendor comparisons. The first is workaround cost.
When a SaaS product covers most but not all of a workflow, the gap is filled by spreadsheets, manual reconciliation, and middleware work that is real but invisible in license budgets. The second is integration tax.
Every system that exchanges data with the platform depends on the vendor's API coverage, rate limits, and deprecation schedule, and those constraints tend to surface only after contract signature.
Custom software carries its own obligations. Maintenance and enhancement commonly run 15–25% of the original build cost annually, security patching never stops, and knowledge concentrated in a small team becomes a continuity risk. These costs are manageable, but only when budgeted from the outset and staffed by a stable team rather than a one-off project vendor that disappears after launch.
In a modeled 250-user scenario, off-the-shelf subscription costs rise 15.5% per year to reach $682,276 by year five, while custom run-rate costs climb only modestly to $314,000 — 54% lower — meaning the organization ends up spending less than half as much annually to operate software it owns outright.
The projection models a mid-market company replacing a 250-user operations platform. The off-the-shelf scenario assumes a $110 per user per month subscription, 10% annual seat growth, a 5% annual price escalator at renewal, $150,000 of implementation, $40,000 per year in integration middleware, and $55,000 per year in administration and workaround labor.
The custom scenario assumes a $780,000 build delivered by an offshore dedicated team, maintenance and enhancement at roughly 20% of build cost, cloud hosting that scales with usage, a part-time internal product owner, and annual security testing. All figures are illustrative and in USD.
| Off-the-Shelf Cost Line | Year 1 | Year 2 | Year 3 | Year 4 | Year 5 |
| Subscription licenses | 330,000 | 381,150 | 440,228 | 508,464 | 587,276 |
| Implementation & configuration | 150,000 | 0 | 0 | 0 | 0 |
| Integration & middleware | 40,000 | 40,000 | 40,000 | 40,000 | 40,000 |
| Administration & workarounds | 55,000 | 55,000 | 55,000 | 55,000 | 55,000 |
| Annual total | 575,000 | 476,150 | 535,228 | 603,464 | 682,276 |
| Cumulative | 575,000 | 1,051,150 | 1,586,378 | 2,189,842 | 2,872,118 |
5-year off-the-shelf total: $2,872,118.
| Custom Software Cost Line | Year 1 | Year 2 | Year 3 | Year 4 | Year 5 |
| Build (dedicated team) | 780,000 | 0 | 0 | 0 | 0 |
| Maintenance & enhancement | 0 | 156,000 | 164,000 | 172,000 | 180,000 |
| Cloud infrastructure | 24,000 | 36,000 | 42,000 | 48,000 | 54,000 |
| Internal product ownership | 60,000 | 60,000 | 60,000 | 60,000 | 60,000 |
| Security & compliance testing | 16,000 | 20,000 | 20,000 | 20,000 | 20,000 |
| Annual total | 880,000 | 272,000 | 286,000 | 300,000 | 314,000 |
| Cumulative | 880,000 | 1,152,000 | 1,438,000 | 1,738,000 | 2,052,000 |
5-year custom software total: $2,052,000.
The shape of the curves matters more than the totals. Subscription costs rise 15.5% per year because seat growth and price escalation compound, reaching $682,276 in year five. Custom run-rate costs rise modestly to $314,000, which is 54% lower.
By year five, the organization spends less than half as much annually to operate software it owns outright, with no per-seat penalty for growth and no renewal negotiation that resets its cost base.
Accounting treatment can strengthen the custom case further. Qualifying development costs for internal-use software may be capitalized and amortized under ASC 350-40 in the United States or IAS 38 internationally, whereas subscription fees are generally expensed as incurred.
The impact on EBITDA and reported margins can be material, so finance and product leaders should model both cash and accounting views with their auditors before presenting the business case.
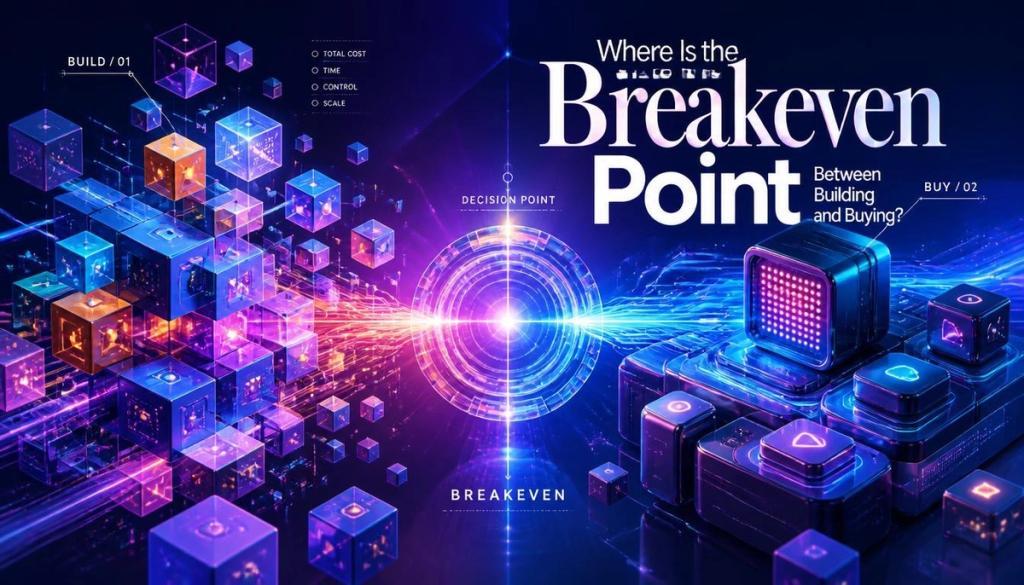
In the base scenario, custom cumulative cost exceeds SaaS by $101,150 at the end of year two, but year-three run-rate savings of $249,228 close that gap within about five months — placing breakeven at approximately month 29 and a five-year custom advantage of $820,118, a 28.6% reduction.
Breakeven is the point at which the cumulative cost of the custom solution drops below the cumulative cost of the subscription alternative. Where Y is the last full year in which custom remains more expensive, a practical calculation interpolates within the following year:
Breakeven month ≈ 12 × Y + 12 × [
  (Custom cumulative at Y − SaaS cumulative at Y)
  ÷ (SaaS annual cost in Y+1 − Custom annual cost in Y+1)
]| Scenario | Seat Growth | Price Escalator | Build Cost | Breakeven | 5-Yr Custom Advantage |
| Conservative | 0% | 3% | $780,000 | About month 35 | $325,015 |
| Base case | 10% | 5% | $780,000 | About month 29 | $820,118 |
| High growth | 25% | 7% | $780,000 | About month 26 | $1,740,353 |
| Base case + 30% build overrun | 10% | 5% | $1,014,000 | About month 39 | $586,118 |
| Base case at US in-house rates | 10% | 5% | ~$1,716,000 | Beyond year 5 | About -$922,000 |
Four insights emerge. Growth is the custom solution's ally: the faster headcount and pricing compound, the earlier ownership pays back.
The high-growth scenario includes an extra $10,000 per year of infrastructure for heavier usage and still breaks even first. Overruns delay breakeven but rarely eliminate it within five years, which is why disciplined scope management and phased delivery matter more than negotiating the last 5% off a build estimate. Most significantly, delivery economics decide the outcome. The same platform built and maintained at US in-house rates never breaks even within the horizon, while an offshore dedicated team returns the investment in under two and a half years.
Cost analysis tells you whether building can pay back; differentiation analysis tells you whether it should — classifying each capability as a core differentiator, competitive parity, or commodity, then scoring it against a weighted matrix, keeps build-versus-buy decisions consistent across the portfolio and defensible in executive review.
| Capability Class | Definition | Examples | Default Approach |
| Core differentiator | Directly drives why customers choose you or pay more | Pricing engines, underwriting logic, proprietary customer workflows, recommendation models | Build |
| Competitive parity | Must meet market expectations but does not win deals alone | Customer portals, partner onboarding, reporting dashboards | Hybrid |
| Commodity | Standardized across industries with mature vendor options | Payroll, email, HRIS, general ledger, identity | Buy |
| Criterion | Weight | Guiding Question | Pricing Engine | Customer Portal | Payroll |
| Strategic differentiation | 30% | Does this capability win deals or margin? | 5 | 3 | 1 |
| Workflow uniqueness | 20% | How far do our processes diverge from market norms? | 5 | 3 | 1 |
| 5-yr TCO advantage of building | 15% | Does the breakeven analysis favor ownership? | 4 | 3 | 2 |
| Data and IP value | 15% | Does owning the data model create strategic leverage? | 5 | 4 | 2 |
| Integration complexity | 10% | Would vendor APIs constrain critical integrations? | 4 | 4 | 2 |
| Time-to-market tolerance | 10% | Can the business wait 4–12 months for value? | 3 | 2 | 1 |
| Weighted score | 100% | Build above 3.5; hybrid 2.5–3.5; buy below 2.5 | 4.55 | 3.15 | 1.40 |
| Recommendation | — | — | Build | Hybrid | Buy |
The matrix deliberately weights differentiation and workflow uniqueness at 50% combined, because those factors determine whether custom investment creates an enduring advantage.
TCO carries meaningful but secondary weight: a capability that is cheaper to build but strategically irrelevant rarely justifies the management attention ownership requires. Revisit scores annually, since capabilities migrate toward commodity as markets mature and vendors catch up, and yesterday's differentiator can become tomorrow's maintenance burden.
Hybrid architectures work because modern platforms expose their capabilities through APIs a company can adopt commercial identity, payments, and CRM platforms.
Then build its differentiating workflows as services that orchestrate those components behind an owned API layer, turning vendors into replaceable suppliers rather than structural dependencies.
The owned layer holds the canonical data model and business rules, so vendors become replaceable suppliers rather than structural dependencies.
The same approach supports gradual migration. Teams already running an off-the-shelf platform can apply the strangler fig pattern, routing specific workflows to new custom services one at a time while the legacy system continues to operate.
This reduces delivery risk, spreads investment across budget cycles, and lets each increment prove its value before the next is funded.
A vendor's SOC 2 Type II report or ISO 27001 certificate covers the vendor's controls, not yours — complementary user entity controls, GDPR sub-processor oversight, and data subject request fulfillment remain the client's responsibility regardless of which platform is chosen, and regulated industries face sharper constraints still.
SOC 2 reports typically list complementary user entity controls that the customer must operate, such as access reviews and configuration management, and auditors will expect evidence that you do.
Under GDPR, the vendor usually acts as a processor under an Article 28 data processing agreement, while your organization remains accountable for sub-processor oversight, transfer mechanisms, and fulfilling data subject requests within the platform's export and deletion capabilities.
Regulated industries face sharper constraints. HIPAA-covered entities need a business associate agreement, which some SaaS vendors offer only on premium tiers.
Data residency expectations in the EU and UK may restrict which vendor regions are acceptable. Custom software removes those dependencies, letting you define encryption, residency, retention, and audit logging precisely, but it also makes your organization and your development partner responsible for producing audit evidence.
Intellectual property is the final consideration. With off-the-shelf software, configuration and data may be portable, but the platform never is, so contracts should secure data export formats and exit assistance. With custom development, insist on full IP assignment, client-owned repositories, and documentation standards that allow any competent team to maintain the system.
The five-year model shows that custom software can be meaningfully cheaper for growing organizations, but only when it is delivered efficiently and aimed at capabilities that differentiate. The decision matrix ensures that investment follows strategy rather than enthusiasm, and the sensitivity analysis confirms how heavily delivery economics shape the return. Geekssort helps product leaders make and execute this decision. Our Bangladesh-based dedicated engineering teams design and build custom software, multi-tenant SaaS platforms, and headless commerce solutions for US, UK, and EU companies, with full IP ownership, client-owned repositories, and delivery economics that bring breakeven inside the planning horizon. Book a build vs buy assessment, and we will score your candidate capabilities against the decision matrix and produce a five-year TCO model using your own seat counts, pricing, and growth assumptions.
Often, for growing organizations. In a modelled 250-user scenario, custom software cost $2.05 million over five years versus $2.87 million for a SaaS alternative, breaking even around month 29. Custom becomes cheaper faster when seat counts and subscription prices grow, and slower when builds overrun or are staffed at high onshore rates.
A production-ready minimum viable product for a business application typically takes four to nine months, while complex enterprise platforms can take twelve months or more. Timelines depend on scope, integrations, compliance requirements, and team stability. Phased delivery lets organizations realize value from early releases while later capabilities are built.
Plan for 15–25% of the original build cost each year to cover maintenance, security patching, dependency upgrades, and incremental enhancements, plus hosting and monitoring. Organizations that underfund maintenance accumulate technical debt that later forces expensive rewrites, eroding the long-term cost advantage of ownership.
Choose off-the-shelf software when the capability is a commodity, workflows match industry norms, time to value is critical, and the vendor's compliance certifications meet your requirements. Payroll, email, HR systems, and general accounting are typical examples where building rarely creates competitive advantage.
Invest in a structured discovery phase, deliver in short increments with working software every sprint, lock scope per release rather than for the whole program, and use a stable dedicated team that retains context. Independent code reviews, automated testing, and monthly TCO tracking against the business case surface overruns early.
Yes. Many organizations launch on off-the-shelf software to validate demand, then migrate differentiating workflows to custom services using the strangler fig pattern. Negotiate data export rights and API access at the outset, and keep a canonical data model outside the vendor platform so migration does not require reverse-engineering your own data.
Prompt copied — paste it into Gemini.

Confused about fixed price vs time and material contracts? Compare the pros, cons, risks, and ideal use cases to choose the right software development contract for your project.

Bangladesh vs Eastern Europe for outsourcing: discover the real differences in cost, talent, communication, and time zones to choose the right outsourcing destination for your business

Hiring a developer without technical expertise doesn’t have to be a gamble. Learn how to vet a developer’s portfolio by checking live projects, recent work, client references, and trial tasks—without reading a single line of code.

Ebrahim KhanFounder & CEO
 We’re happy to sign an NDA upon request.